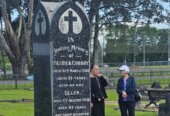

1949 San Juan eruption in the island of La Palma
When it comes to volcanic eruptions, people love numbers, especially big ones.

Janine Krippner
The largest eruption in 20 years, the highest ash plume in our lifetime, the most terrifying pyroclastic flows – these make great headlines. But behind these impressive figures lies a lot of careful work to measure, verify, and confirm what actually happened.
One measure of the size of an eruption is the Volcanic Explosivity Index (VEI). As soon as an eruption begins, estimates start circulating, often stated as fact. This looks at the amount of material that was erupted, and ash plume heights, so this is not calculated until an eruption has ended.
To calculate volume, how much magma was erupted in total, as well as the breakdown into ash (pulverized rock), lava flows, or pyroclastic flows, can be a bit tricky and generally takes a mix of field work, computing power, expertise, and time.
It is important to understand the eruption volumes of past events so that we can understand what future scenarios might look like. To explain how we calculate the volume of lava produced during an eruption, I am sitting in Tenerife with Sergio Alfaya, who is working with me at GeoTenerife. Sergio has calculated lava volumes for past eruptions across the island of Tenerife, as well as the 2021 La Palma eruption.
One challenge with lava flows compared to other volcanic processes is that it entirely buries the landscape. The La Palma lava flow field (made up of many individual lava flows erupted over the three-month period) reaches around 75-100 metres thick in places. To put that into perspective, the typical height of a room is about 2.5 metres high.

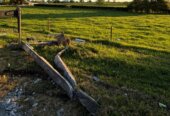
1909 Chinyero eruption in the island of Tenerife
We have to “reconstruct” what the landscape looks like before the lava covered it. For recent eruptions we can compare before-and-after satellite data, but for older eruptions we don’t have that luxury. For those we have to rely on historical maps and imagery to build a mathematical model of the pre-eruption terrain.
We use satellite imagery and drone data to capture the surface detail of the lava flows. With these datasets, we can compute how much lava now buries the landscape.
The La Palma eruption is the first in the Canary Islands to have high-quality data from both before and after the eruption. Researchers like Sergio can use this to refine their volume calculations and validate or test their methods.
The final result? The La Palma lava flow measures approximately 177 million cubic meters (m³). If we think of a dump truck typically carrying 10-14 m3 per load, it would take about 14 million truckloads to move that much lava. For another comparison, building Auckland’s Sky Tower required around 15,000 m³ of concrete. La Palma’s lava flow field is more than 11,000 times that volume.
Understanding the lava flow volumes from past eruptions allows us to run simulations of eruptions across different locations to see where they would go, and what the impacts to communities would be. Each step, from data collection to computer modelling, takes careful consideration and testing so that our science can be used to inform decisions and protect lives.

1949 San Juan eruption in the island of La Palma